Components of a Business Intelligence Solution
There are many different technical frameworks available for implementing a business intelligence solution, all offered by a variety of vendors. In a general sense though, there are three overarching pieces to business intelligence:
- Integration and the data warehouse
- Data cubes and analytics
- Dashboards, KPI’s and reports
Understanding these pieces and how they work in tandem to address organizational needs is critical in software consulting to achieve a successful implementation. I will be covering one each week for the next few weeks, starting with integration and the data warehouse.

Azure Data Factory Unpacked
Data is one of the critical elements of any enterprise because it informs day-to-day operations. Running an organization or working on specific projects is not possible without the necessary information. Systems also depend on the information you feed into them for them to function. This suggests that data is an essential part of the operations of any company.
Data is a critical part of any entity. Over time, companies collect and store a massive volume of data. Turning such details into meaningful use can be a challenge if you do not have the necessary resources. Azure Data Factory (ADF) proves to be a tremendous resource for business operators, and here are more details about this resource.
What is Azure Data Factory (ADF)?
ADF is a service that allows you to convert data from relational, non-relational, and various storage systems into useful information with data-driven workflows. As a result, entrepreneurs can:
- Map strategies.
- Create value.
- Attain specific objectives using the details they retrieve from the ADF.
Data scientists, business decision makers, and analysts can also use the information that the ADF avails to draw the insight they need so they can advise management accordingly.
ADF is a managed, cloud-based data integration service. That means that it can handle:
- Complex hybrid extract-load-transform (ELT),
- Extract-transform-load (ETL), and
- Data integration projects using a drag and drop interface.
Alternatives to Azure Data Factory
Several tools can serve as alternatives for ADF including;
1. IBM InfoSphere DataStage
The IBM InfoSphere DataStage is an ETL platform. It integrates data from multiple enterprise systems. Also, it is available both in the cloud and on-premise.
2. Apache Sqoop
If you want to transfer bulk data, you can consider using Apache Sqoop because it facilitates such exchanges between Apache Hadoop and such structured datastores as relational databases.
3. Data Virtuality Platform
The ability to access data from various sources is part of the prerequisites for most businesses today, and you can achieve that through a Data Virtuality Platform. As an integration solution, the Data Virtuality Platform promotes instant access and modeling of data from various databases and API with analysis tools.
4. Denodo
There is a wide variety of enterprise, cloud, and Big Data sources out there and getting unified access to such sources is critical if your company has a considerable volume of data. Denodo promotes access to a wide range of unstructured, enterprise, cloud, and Big Data sources for business owners who want to leverage the details that their systems generate.
5. Pipes
Integration of data from over 150 APIs and databases into a data warehouse through Pipes is possible, and it does not take much time.
Azure Data Factory Pricing
 The cost of Azure Data Factory services depends on:
- Whether a pipeline is active or not,
- The number of activities you run,
- The number of compute hours necessary for SQL Server Integration Services (SSIS), and
- The volume of data you move.
In some cases, the pricing of Azure Data Factory services does not include setup, upfront, or termination costs because the cost of this service depends on usage.
The Role of ADF in Data Management
ADF plays a significant role in the management of data including;
- Supports such procedures as building, debugging, deployment, operationalization, and monitoring of big data pipelines. The implication, in this case, is that you can integrate and deploy your ETL/ELT workflows to such environments as Dev, Test, PROD, among others.
- It simplifies the processing of large volumes of data.
- Facilitates the publishing of output data to such data stores as Azure SQL Data Warehouse for business intelligence apps. This means that users can organize raw data meaningfully and that will enhance the decision-making process.
- Allows users to create and schedule data-driven workflows that can ingest data from different sources. Processing and transforming data using such services as Azure Machine Learning, Azure HDInsight Hadoop, Azure Data Lake Analytics, and Spark is also possible through ADF.
Advantages of ADF Over On-Prem Data Pipes
1. Patching Is Not Necessary
Sometimes, making changes in computer systems is necessary if you want to enhance their performance, update the software, or fix a particular problem. Patching makes changes in computer systems when the need arises, and it is an essential exercise for those who use on-premise platforms.
ADF will withdraw the need for patching systems from your shoulders since your cloud services provider will assume this responsibility. For that reason, cases of security vulnerabilities become the least of your worries. In turn, you can focus your attention on revenue-generating activities.
2. It Reduces Operating Costs
The fact that the number of compute hours necessary for SQL Server Integration Services (SSIS), the activities you run, and the volume of data you move dictate the pricing of ADF services suggests that this resource will not blow your budget through the roof. In fact, the total cost you expect to pay for ADF services will depend on how long your pipeline remains active.
3. No Hardware Expenses
Entrepreneurs focusing on reducing their operating costs will most likely automate their business processes. One of the things you should consider when developing an automation strategy for your enterprise is cloud services. The reason is that you will not need to invest in on-premise hardware when you opt for cloud services. Vendors of these services provide all the necessary equipment off-site.
ADF is a cloud service that saves you the cost of investing in the hardware you need to support this resource. This means that you will save on space and labor as well.
Although ADF’s primary role is to work with Azure storage services, it can integrate with other Azure services. This promotes seamlessness in business operations. More and more business owners are opting for interdependent systems or platforms that support the integration of existing applications in their offices. They know that doing so will improve productivity and ADF fulfills this requirement too.
If your enterprise has been in operation for a while now, there is probably a lot of data that remains unutilized for one reason or another. However, the ability to leverage such information can be the next big thing that will open new frontiers for your firm. ADF captures the details you need to understand your business better. As a result, you will gain the knowledge necessary for making decisions that will scale your operations.
Spotfire Dashboard Demo of a Shale Type Ternary Diagram, Well Map, and Source Wells by Formation
Since rock type will have a bearing on completion and drilling practices, you definitely want to know the results of wells with similar rock types. Normally, geologists, petrophysicists, and reservoir engineers who need to find data from wells and formations by rock type to perform evaluations have to plot out data in Excel, but making selections off of an Excel chart is impossible, and filtering table data can often end up being hit-or-miss. Instead, you could create a ternary diagram in TIBCO Spotfire paired with a geographic map of the location of the wells to perform formation evaluations. The Spotfire dashboard demo here provides interactive functionality with a well map and ternary diagram.
Click the video to play the demo:
As you can see, there will be a direct bearing on what to pay for land in a shale oil or shale gas play when you monitor how the lithology of a formation is changing by moving your area of interest.
To purchase a version of this Spotfire dashboard tailored to your own data, give us a call at 1-888-343-KNOW or send me a note using the form to the right.

Entrance to present on Master Data Management (MDM) at PNEC 2014
Entrance is excited to be a sponsor and featured presenter at the 18th International Conference on Petroleum Data Integration, Information, and Data Management taking place in Houston, Texas, May 20-22, 2014 at the JW Marriott hotel.
The 2014 PNEC is a power-packed, two-and-a-half-day technical program featuring 48 in-depth technical presentations and panels led by data management professionals and experts from around the world. The sessions will focus on real-world issues, best practices, developments, and cross-discipline advances that address the ever-expanding and complex data demands in today’s oil and gas industry. Read More
Entrance Demonstrates How to Frac Your Data at Microsoft Global Energy Forum
Showcasing Custom Software Solutions
Entrance is a proud sponsor of the annual Microsoft Global Energy Forum, to take place on February 20th in Houston at the George R. Brown Convention Center. Now in its 11th year, this prestigious technology-focused energy industry event welcomes business leaders from both the Business Operations and Information Technology arenas.
As a long-standing Gold Microsoft Partner, Entrance will showcase custom software solutions for oil and gas. The SharePoint enterprise content management company, KnowledgeLake, will be joining as a co-sponsor to share how upstream companies can leverage digitization solutions.
Actionable Insight for the Field
Attendees of the Global Energy Forum can stop by booth number 116 to learn more about:
- Business Intelligence and Data Management: Tying together disparate databases to reveal actionable insight for the field
- SharePoint and KnowledgeLake: Instant, searchable, digitized access to any paper assets
- Business Process Automation: Reduce overall lifting costs by automating data from the field
Entrance president, Nate Richards, commented on the upcoming event, “Information is the next unconventional play for oil and gas,” said Entrance president Nate Richards. “Decision makers need to be able to frac their data across departments to access intelligence that is readily available and accurate. This is the key to driving up production and pushing down costs for the successful producer.”
The Move Towards Digitization
Now more than ever, the oil and gas industry is grappling with an overwhelming amount of unstructured paper data and paper. Entrance and KnowledgeLake have partnered for the Global Energy Forum to showcase a digitization and well management solution based in SharePoint for land and well files that will help drive true competitive advantage.
“We are excited to partner with Entrance Software to provide the next generation of Energy Information Management solutions based on Microsoft SharePoint. By leveraging SharePoint to manage unstructured content and structured data, we are able to provide upstream customers with real time actionable information for Well File, Land and corporate records groups that was only before possible with multiple point solutions,” said Vice President of Engineering at KnowledgeLake, Ben Vierck.
Visit the team on February 20th for a demo, or to pick up a copy of the first annual Outlook on Energy.
For more, check out our presentation that explains how your company can frac your data to avoid lease jeopardy. Or find out more about the Microsoft Global Energy Forum.

Keys to Business Intelligence
Five key insights from business intelligence expert David Loshin
In a recent interview, David Loshin, president of business intelligence consultancy Knowledge Integrity, Inc.,
named five key things organizations can do to promote business intelligence success: Read More
Business Intelligence: What is Hadoop?
Hadoop: The New Face of Business Intelligence
Big data has changed the way businesses handle their business intelligence initiatives, requiring them to capture, process, and analyze exponentially larger amounts of information. Traditional business intelligence tools like relational databases are no longer sufficient to handle the level of data businesses are experiencing.
If businesses are going to take advantage of the insights offered by big data—instead of drowning in the flood of useless and irrelevant data—they are going to need new tools to help them handle the data crush. Read More
Data Management: Measuring Quality
Data Management for Upstream
In the world of data management, there are two factors that are important to account for: quality and access.
Measuring data quality was the topic of a PPDM presentation by Jeremy Eade, a Subsurface Data Lead at BP. His approach to data management specifically surrounded the consistency of data surrounding wells. Read More
Oil and Gas Software: Decision Making and Forecasting
Oil and Gas Software and the Accuracy of Decisions
Oil and gas software can be one key to integrated, well structured, well defined IT systems. Data support utilizing an oil and gas specific framework leads to intelligent decision making and a reduction in overhead.
Case study: Oil and Gas Business Intelligence Framework
Data access, forecasting and analysis, reporting and decision making software for dedicated professionals, from the field to the boardroom, are available with solutions developed by Halliburton, Dell, Qualcomm and Microsoft.
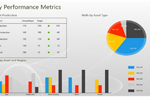 The Oil & Gas Business Intelligence framework, iLink, offers a comprehensive real-time overview of your business. You can track performance metrics that will provide you with the necessary information to make informed business decisions. Dashboards offer an easy to access overview. The process of resource optimization will help to make reliable forecasts based on the most current data. Managers and technicians in the field can communicate data, while tickets and alerts can be created for field personnel.
iLinks key features are:
· Identifying Key Performance Metrics
· Monitoring Well Performance
· Creating and assigning well issue ticketing and alerts
· Global well map
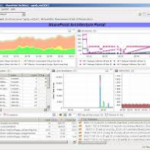
Microsoft’s partnering with Halliburton has developed the architecture for their oil and gas upstream framework, MURA. This architecture supports business with the goals of gaining maximum insight from business data and maximizing worker productivity. The framework supports real time analytics, including robust statistical and analysis packages for data mining, research and consumer reporting.
It also supports stream-processing engines capable of detecting and filtering real-time events, on site or in the cloud.
Information integration enables diverse data and software to seamlessly function without being trapped in a pipeline to nowhere. Workers need tools that help them gain deeper insights into ever growing quantities of relevant data.
Simplifying the process of finding, selecting, and exploring their data in flexible ways is essential. This process needs to be intuitive for them, and they should not have to rely on IT to fetch data or write custom reports.
You can deliver cost effective solutions with MURA that are highly mobile because of interoperability in the cloud and on-site. MURA supports industry standards. An industry wide interface makes new, competent implementation such as PPDM understandable and manageable.
MURA interfaces are published for open industry use. All the elements of an interface are well defined so that applications can be independently developed once per function. Wasteful duplication of effort can be avoided.
Information models employ a consistent naming system for referring to assets. This makes information sharing, exchange and comprehension an understandable process.
Security implementation is robust and well defined, including authentication, identity lifecycle management, authorization, certificates, claims and threat models. This facilitates secure interoperable design and deployment. Solutions that integrate business processes, workers, workflow and IT processes with essential and immediate data support intelligent workflow.
Business Intelligence in Action
K2 uses MURA to manage declining well process. The MURA framework provides guidance for oil and gas companies for creating a dashboard of applications that are integrated at the user interface layer.
This kind of oversight capability gives well operators the data and context they require be alerted to issues that need timely corrective action. K2 optimizes information provided to decision makers, while minimizing data that is superfluous or in an obscure format. IT departments appreciate MURA and K2 because costs are restrained while business demands are effectively met.
Demand forecasting simplifies and automates enterprise-wide forecasting, and improves the quality and measurability of marketing planning. When you improve accuracy significantly, it is likely to result in improved capital decisions and effective communication that will ultimately bring a reduction in overhead and operating costs.
For more on how oil and gas software can help your business, read this post on the benefits of analytics.
SharePoint Dashboards: Three Reasons to Build Your One-Stop Shop
Surfacing Vital Information with SharePoint Dashboards
Your Sharepoint dashboard is similar to the dashboard in your car; it contains all the information that is pertinent to your oil and gas operation so you can easily and quickly find what you need. If you haven’t set up your dashboard, it is important to contact a Sharepoint consulting firm to help you get started on this vital task.
The benefits of having your Sharepoint dashboard fully operational are numerous. Here are the basics of the Sharepoint dashboard to help you get an understanding of why it is so important for your oil and gas business.
One-Stop Shop
 Like I said above, the dashboard is your first stop for information, and should contain relevant items that are used by employees for daily functions. You can include so many things on your dashboard, from forms to stock quotes, maps and plans, and even statistics and budget information.
The dashboard is completely customizable to the needs of your business and to support your daily operations. Your Sharepoint consulting professional can help you determine how you’d like your dashboard to be set up, and what information you need to include.
Drill-Down Menus
The drill-down menu options on the Sharepoint dashboard are one of the most popular among users. You can have many types of drill-downs on your dashboards, with links to information on companies, rigs, wells and assets. Here are a few examples to get your creative juices flowing:
Company –> Field –> Well
Company –> Asset –> Field –> Well
Asset Type –> Field –> Well –> Completion
Area –> Block –> Lease –> Well –> Completion
Plat –> County –> Lease –> Well
As you can see, the options for drill-down menus are endless, and can link to numerous pieces of vital information on current and closed operations.
Filters
Filters are also important when you are setting up your Sharepoint dashboard. You can add filters for operational and non-operational wells. You can also filter by product type, such as oil or gas wells.
Geographical data can be another way to filter information. This allows the user to quickly and easily find the information they need, so they aren’t spending all of their time trying to find what they need to accomplish their mission.
Visualization
Your Sharepoint dashboard also helps users to visualize information so they can gain a better understanding of trends and performance indicators. This will also assist in making business decisions and help further your business reach. You can add charts and graphs to make the information easier to understand and retain.
The Sharepoint dashboard is one of the most important aspects of your Sharepoint site, so it’s important to do it right. Once you have your dashboard set up, it is fairly easy to maintain, and this duty can be handled by an employee in just a few minutes a day.
You will also find that operations run more smoothly when everyone has instant access to the information that they need!
To see how SharePoint dashboards helped one Entrance client accomplish this, check out this case study.
Business Intelligence Deployment Misconceptions
Deploying Business Intelligence
Business intelligence, also commonly referred to as BI throughout the industry, is a piece of technology that allows a business to obtain actionable information that they can then use throughout their day-to-day operations. While business intelligence solutions certainly have their fair share of advantages, it is also important to realize that they are not the be-all, end-all solution for guidance that many people think they are.
There are certain business intelligence deployment misconceptions that businesses make over and over again to their detriment. Understanding these misconceptions will allow you to successfully avoid them and use BI to its fullest potential.
The Benefits of Business Intelligence
- The information provided is accurate, fast and, most importantly, visible to aid with making critical decisions relating to the growth of a business, as well as its movement.
- Business intelligence can allow for automated report delivery using pre-calculated metrics.
- Data can be delivered using real-time solutions that increase their accuracy and reduce the overall risk to the business owner.
- The burden on business managers to consolidate information assets can be greatly reduced through the additional delivery and organizational benefits inherent in the proper implementation of business intelligence solutions.
- The return on investment for organizations with regard to business intelligence is far-reaching and significant.
Business Intelligence Deployment Misconceptions
 One of the most prevalent misconceptions about business intelligence deployment is the idea that the systems are fully automated right out of the box. While it is true that the return on investment for such systems can be quite significant, that is only true if the systems have been designed, managed and deployed properly.
A common misconception is that a single business intelligence tool is all a company needs to get the relevant information to guide themselves into the next phase of their operations. According to Rick Sherman, the founder of Athena IT Solutions, the average Fortune 1000 company implements no less than six different BI tools at any given time.
All of these systems are closely monitored, and the information provided by them is then used to guide the business through its operations. No single system will have the accuracy, speed or power to get the job done on its own.
Another widespread misconception is the idea that all companies are using business intelligence in the present term and your company has all the information it needs in order to stay competitive. In reality, only about 25 percent of all business users have been reported as using BI technology in the past few years. The 25% number is actually a plateau – growth has been stagnant for some time.
One unfortunate misconception involves the idea that “self-service” business intelligence systems indicate that you only need to give users access to the available data to achieve success. In reality, self-service tools often need additional support than what most people plan for.
This support is also required on a continuing basis in order to prevent the systems from returning data that is both incomplete and inconsistent.
One surprising misconception about the deployment of business intelligence is that BI systems have completely replaced the spreadsheet as the ideal tool for analysis. In truth, many experts agree that spreadsheets are and will continue to be the only pervasive business intelligence tool for quite some time.
Spreadsheets, when used to track the right data and perform the proper analysis, have uses that shouldn’t be overlooked. Additionally, business users that find BI deployment too daunting or unwieldy will likely return to spreadsheets for all of their analysis needs.
According to the website Max Metrics, another common misconception is that business intelligence is a tool that is only to be used for basic reporting purposes.
In reality, BI can help business users identify customer behaviors and trends, locate areas of success that may have previously been overlooked and find new ways to effectively target a core audience. BI is a great deal more than just a simple collection of stats and numbers.
For more on this topic, check out our series, “What is business intelligence?“
Oil and Gas Software: Real-Time Information Improves Collaboration
SCADA and Oil and Gas Software
Providing upstream SCADA information systems with near real time field metrics using oil and gas software is essential to the efficient management of shale gas exploration and development. Rapid, informed response to fast changing dynamics across multiple upstream sites requires reliable source data capture and quick availability.
Business Intelligence Tools: Power BI First Impressions
Business Intelligence and Power BI
This is an exciting time for SharePoint consulting and business intelligence as Microsoft moves more of its offerings into the cloud. The Power BI preview comes with several features for data query, data visualizations, collaboration, and mobility. Additionally there are new add-in components for the Excel client.
Data Management: Leveraging Unconventional Assets for Oil and Gas
Unconventional Assets and Data Management
New risks create a need for improved data management in the oil and gas world. One of the greatest risks in unconventional shale development is the risk of not being able to manage an increasingly complex group of assets in an environment that is constantly changing.
Business Intelligence Implementations and the Importance of Collaboration
Business Intelligence and Collaboration
If your business intelligence implementation project has not been as successful as you hoped it would be, then you’re not alone: a 2012 survey from the research and consulting company BI Scorecard found that only 24 percent of respondents thought their business intelligence implementations were “very successful.”
The majority of the survey respondents said that their business intelligence projects had been helpful to business operations, but not as helpful as they had hoped.
According to Ed Burns, the site editor for SearchBusinessAnalytics, a lack of effective collaboration is one of the main reasons business intelligence projects end up under-performing. Burns argues that there is often a gap between IT and business personnel: in many companies, business intelligence implementations are considered IT projects, because the IT department is actually responsible for putting the systems together.
However, the overall success of business intelligence implementations is measured in business terms, not technical terms. If IT lacks an understanding of what business outcomes the implementation is expected to drive, then it should come as no surprise when the implementation doesn’t drive those outcomes.
So, if greater collaboration is the key to driving more successful business intelligence implementations, what can be done to encourage that collaboration? Trying to get business and IT to talk to one another may be incredibly difficult in some organizations, but Burns offers a couple of suggestions for initiating better collaboration.
Agile Enables Business Intelligence
First of all, using Agile development methodologies during the business intelligence implementation might help. By their very nature, Agile methodologies force business and IT teams into close contact with one another throughout the development process, so greater collaboration between the two will come about as a natural by-product of using Agile.
Also, the fact that the collaboration is ongoing is significant: business users will have ample opportunity to inform their IT counterparts should their needs around business intelligence ever change.
IT teams should also make an effort to communicate with business teams in their own language. This means no technobabble, and no gratuitous use of acronyms. It might help for business and IT users to meet and discuss the project goals in an informal setting, such as over lunch.
Meeting outside of the workplace may open up a more effective, easy-to-understand dialogue between the two teams.
Business Intelligence Champions
Organizations might also elect to choose a “business intelligence champion” to serve as a link between the two teams. This person may originate from the business or IT side of the implementation, but the key point is that he or she should be able to understand the implementation project from both sides: the technical issues that the IT team is running into, as well as the needs that the business users are trying to meet with the final business intelligence solution.
Having a neutral party involved that can speak the language of both groups can help keep the lines of communication open as the implementation progresses.
In the end, each individual organization has to arrive at their own decision about exactly how to position their business intelligence implementation projects between the business team and the IT team. As Burns suggests, keeping open communication and collaboration between the two teams is the most effective way of creating a technically sound implementation that also meets the needs of the business users.
If your organization has been having trouble with creating a successful business intelligence implementation, Burns’ suggestions may hold the key to overcoming your setbacks.
For more on improving business intelligence, check out this post on changing up how we think about the IT service model…
Data Management for Oil and Gas: Unconventional Data versus Big Data
Unconventional Data Management
In Unconventional Hydrocarbons, Big Data, and Analytics, Allen Gilmer of Drilling Info (DI,) explores unconventional data management in the hydrocarbon industry. Each day about 50 experiments take place.

Mergers and Acquisitions: Getting the Numbers Right
Merger and Acquisitions and Valuation
Amassing the right data is paramount to being able to arrive at an accurate valuation during mergers and acquisitions. Without data, it is easy to make decisions based on inaccurate intelligence.
Oil and Gas Software: Top Concerns from Merrick Users
Getting the Most from Oil and Gas Software
A few weeks ago, several Entrance software consultants attended an event on oil and gas software, the Merrick MUG user conference. We’ve already covered this event in a blog post on knowing when to upgrade energy software.
Business Intelligence and Decision Making
Using Business Intelligence to Keep Pace
The pace of our daily work life goes ever faster, and for many knowledge workers, business intelligence is a vital tool for keeping up. In particular, companies are finding that decisions they might have delayed for hours — or even days — a few short years ago must now be made within minutes.
Business Intelligence and ROI: Weighing the Business Value
ROI is King for Business Intelligence, or Is It?
I came across this article on Search Business Analytics today called, “Bow Down to the IT Throne on all Business Intelligence Projects?” The author, Craig Stedman, shared some interesting thoughts on weighing ROI with other business priorities, such as usability or fit with requirements.